Streaming Data Dashboard with Grafana
About This Project
This project is an end-to-end, real-time quantitative analytics platform that monitors global macro-economic indicators, including Bitcoin, Gold, Silver, and the US Dollar Index (DXY). Data is continuously fetched from the Yahoo Finance API via a Python producer and streamed asynchronously through an Apache Kafka cluster. A dedicated Python consumer processes these events and writes them into InfluxDB, a high-performance time-series database. The architecture goes beyond simple data display by incorporating a quantitative engine built directly into Grafana, featuring dynamic threshold alerts, moving average (SMA) crossovers, and a rule-based Market Regime detection algorithm. The entire infrastructure is containerized and hosted on an AWS EC2 instance, secured with a Caddy reverse proxy.
The source code for this project is available on GitHub at the following link: Real-time Finance Dashboard.
Key Features
- Event-Driven Architecture: Decoupled Python Producer and Consumer microservices communicating reliably via an Apache Kafka message broker.
- Quantitative Analytics Engine: Real-time calculation of Gold/Silver ratios, momentum percentages, and logical market regime signals (Bullish/Bearish) using Grafana Math Expressions.
- Fully Automated CI/CD: A GitHub Actions pipeline automatically rebuilds and deploys the Docker Compose stack to the AWS EC2 production environment upon every code push.
Technologies Used
- BI / Visualization: Grafana (Embedded Kiosk Mode)
- Data Streaming & Storage: Apache Kafka, Zookeeper, InfluxDB
- Data Processing: Python, Yahoo Finance API (yfinance)
- Cloud & DevOps: AWS (EC2), Docker, GitHub Actions, Caddy (SSL/Proxy)
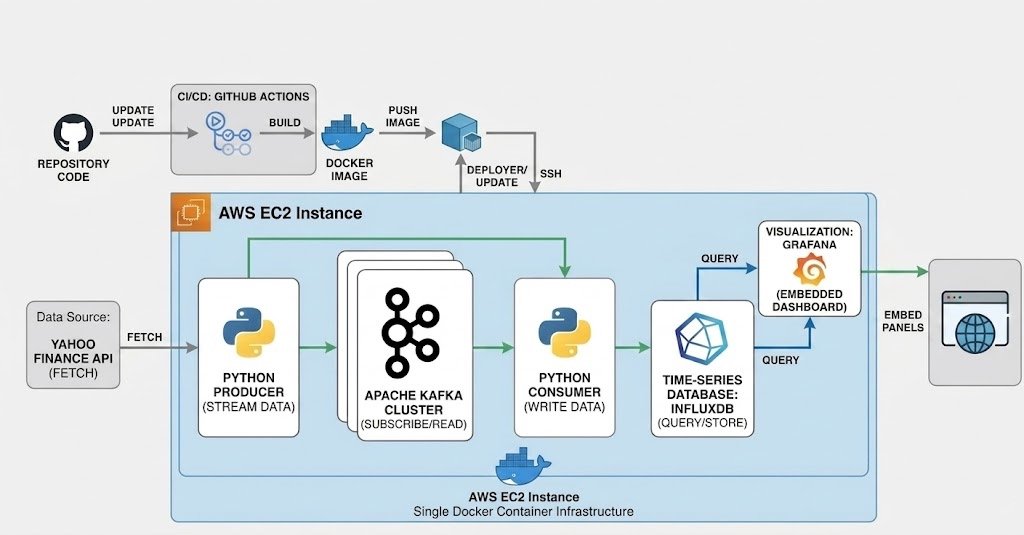
Figure: Streaming Finance Dashboard with Kafka